NetWatch
Network and VPN latency diagnostics for Windows: shows whether the delay comes from Wi-Fi, the router, the internet or the tunnel. No installation, no admin rights.
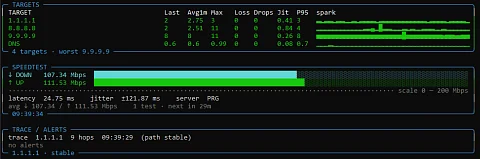
NetWatch is a network and VPN latency diagnostics tool for Windows. Every company help desk knows the complaint "the VPN is slow". The cause can sit in four places: weak Wi-Fi at the employee's home, an overloaded router, the internet provider, or the VPN tunnel and whatever is behind it. NetWatch measures all four layers at once, continuously and with timestamps, and shows which of them adds latency or packet loss. It is a console program that you copy to the affected computer and run as a regular user.
Why ping and a browser speed test are not enough
The usual help desk routine is to send the user instructions: run ping -t, then tracert, and finally measure speed on a website. The result is three screenshots from different moments, a ping without timestamps and a speed test that saturates the line, so the ping shows losses at that moment that would not otherwise be there. A problem that comes and goes is not captured at all.
NetWatch runs all measurements in parallel and writes them to files for the whole run. It treats the speed test separately: while the test runs, it pauses ping and traceroute (with a short margin for the load to settle), so the saturation caused by the test is not recorded as packet loss or higher latency.
What the help desk and the user get
No installation and no administrator rights
The whole program is a single 233 KiB file, netwatch.exe, plus a short netwatch.exe.config. It runs on .NET Framework 4.8, which ships with Windows 10 and 11, and uses no NuGet packages. Ping goes through the system ICMP service (System.Net.NetworkInformation.Ping), not raw sockets, so even a user on a locked-down company laptop can run it.
All network layers in one window
- the active adapter, link speed, traffic and error counters, and for Wi-Fi also the network name, signal strength in percent and approximately in dBm, negotiated rate, 802.11 standard and channel,
- ping to the default gateway, that is, the router,
- ping to public addresses (1.1.1.1, 8.8.8.8 and google.com by default) and to the first DNS server of the active adapter,
- ping to the VPN tunnel gateway, the public VPN endpoint and internal servers behind the tunnel,
- traceroute with name resolution every five minutes, which reports route changes,
- download and upload speed, idle latency and jitter.
For each target the program computes the last, average and maximum latency, jitter, the 95th percentile, loss rate and number of outages. It takes latency from the value reported by the system, not from timing inside the program.
It finds the VPN by itself
It detects the VPN adapter without configuration and regardless of vendor: WireGuard, OpenVPN, FortiClient, Cisco AnyConnect, GlobalProtect, Zscaler, Pulse Secure, SonicWall, Check Point, Sophos, NordLynx, Proton VPN, Mullvad, Tailscale, ZeroTier and WAN Miniport or TAP adapters. When the adapter does not reveal the tunnel gateway, for example with WireGuard and a /32 mask, it looks it up in the routing table. A VPN connected after startup is picked up automatically.
A speed test that says where the number comes from
It measures speed against public Cloudflare endpoints over HTTPS on port 443 and respects both system and corporate proxies. When a measurement fails, it states the specific reason (such as HTTP 429 or a timeout), retries with a single connection and then falls back to the nearest Ookla Speedtest server. Every number is labelled with its source. By default the test runs at startup and then every 30 minutes.
Data you can attach to a ticket
The logs folder next to the program receives a readable log with periodic summaries and four daily CSV files: ping, speed, traceroute and interface state. Each record is written immediately, so the data survives even a forced termination. The -report switch turns them into an HTML page with charts for the last 5 minutes, hour or 24 hours; it can be zoomed, downloaded as PNG or CSV, and refreshes itself every minute while measuring.
How to use it
Without parameters it opens a live dashboard made of panels: connection and VPN state, a table of targets with a small latency graph, the speed test with a countdown to the next one, and the last traceroute with events. Rows are coloured by state and the dashboard redraws when the window is resized. It draws through the Console API, so it depends neither on ANSI support nor on the system language. Ctrl+C stops measuring and writes a final summary.
-onceruns one round (interfaces, four pings per target, one traceroute, one speed test) and prints a text report,-no-uimeasures without the dashboard, for example when output is redirected,-frameprints a single frame of the dashboard and exits,-configand-logdirset a different configuration file or log folder.
Targets are set in netwatch.conf, which the program creates with comments on first run. For a company VPN you add the public endpoint address (vpn_server) and the internal servers the user needs to reach (vpn_targets). The default alert thresholds are 40 % Wi-Fi signal, 150 ms latency and 5 % loss; exceeding one is logged as an event.
Typical use
- An employee working from home complains about a slow VPN. The help desk sends
netwatch.exewithvpn_serverfilled in, lets it run for a day and tells from the logs whether losses start on the Wi-Fi or only in the tunnel. - Outages that occur once an hour: the daily CSV files show the exact time and layer, so you can prove to the provider that the problem is on their side.
- A quick check before escalation:
-onceproduces a text report within a minute that can be pasted into a ticket.
What the program sends out
NetWatch has no telemetry and no account. It only sends pings and traceroutes to the configured targets and the speed test to speed.cloudflare.com, or on failure to an Ookla server selected through speedtest.net. The speed test can be turned off in the configuration (speedtest_enabled). Logs stay in the folder next to the program and contain addresses, Wi-Fi network names and traceroute paths, so it is worth reviewing them before sending them outside the company.
Project status
NetWatch is a finished tool at version 1.0.0. Since the release only the documentation in the repository has changed. The README's requirements still mention a file of about 100 kB, while the released netwatch.exe is 233 KiB. The program runs only on Windows 10 and 11. The speed test needs access to Cloudflare or Ookla servers; where a firewall blocks them, NetWatch keeps measuring only latency and loss.
Download
Release 1.0.0 from 7 June 2026 contains netwatch.exe and netwatch.exe.config; copy both files side by side to the affected computer. The program is not in the Microsoft Store. To build from source, run dotnet build -c Release or the build.ps1 script, which puts the finished file into the dist folder; the only requirement is the .NET Framework 4.8 targeting pack.
Source code
The code is on GitHub in the nks-hub/netwatch repository under the MIT licence. Report bugs in GitHub Issues.